What is churn?
Churn is the share of your customers or subscriptions that stops in a period; another word for it is attrition. The churn rate is that share as a percentage: the number of subscriptions that stopped in a period, divided by the number that were running at the start of that period.
For a shop that sells subscriptions, subscription churn is a cancellation, or a subscription that stops after failed payments. For a shop without subscriptions it is a customer who does not come back. The mirror image is retention: the share that stays.
Churn is one number, but there are three choices behind it: what you count as stopped, which period you measure and who you include at the start. Below is the formula with a worked example, what a monthly figure means over a year and why no single norm fits every shop.
The churn rate formula
Churn rate = the number of subscriptions that stopped in the period ÷ the number of running subscriptions at the start of the period × 100%. An example: on 1 September 400 subscriptions are running and 14 stop during September. Churn for September is 14 ÷ 400 = 3.5%.
Two things often go wrong here. Divide by the number at the start of the period, not the number at the end. Someone who joins halfway through the month was not yet part of the group that could stop; if you include those subscribers, churn looks lower than it is. And do not count a pause as a cancellation: a paused subscription still exists and can start again.
| What happens | Counts as churn? | Why |
|---|---|---|
| The customer cancels | Yes | The subscription stops at the customer's request |
| The subscription stops after failed payments | Yes | It no longer runs, even though the customer did not ask for that |
| The customer pauses | No | The subscription still exists; track pauses as a separate figure |
| The customer skips a delivery | No | The subscription simply continues |
| A new subscription starts in the period | Not part of the denominator | It was not yet running at the start of the period |
From month to year
A monthly figure looks small, but it compounds. At 5% churn per month, 0.95 to the power of twelve remains after twelve months: 54% of the group you started with. Multiplying by twelve gives 60% churn and that is wrong, because every month 5% drops off a group that has already become smaller.
| Churn per month | Still running after 12 months | Expected lifetime |
|---|---|---|
| 2% | 78% | 50 months |
| 3% | 69% | 33 months |
| 5% | 54% | 20 months |
| 8% | 37% | 12.5 months |
| 10% | 28% | 10 months |
The expected lifetime is one divided by the monthly churn. The table assumes that churn is the same every month. In practice it rarely is, which is why you also look per cohort, further down in this article.
Customer churn and revenue churn
The formula above counts subscriptions. That is customer churn. Revenue churn measures the same thing in money: the monthly revenue (MRR) of the subscriptions that stopped ÷ the MRR at the start of the period. The two diverge as soon as subscriptions are not all worth the same.
In the September example: the 400 subscriptions are worth € 10,000 per month together. The 14 that stop were worth € 280 together, so revenue churn is 2.8% while customer churn is 3.5%. Here it is mainly the smaller subscriptions that leave. If it is the other way round, you are losing your best customers, and that is a different problem from what the percentage alone shows.
Voluntary and involuntary churn
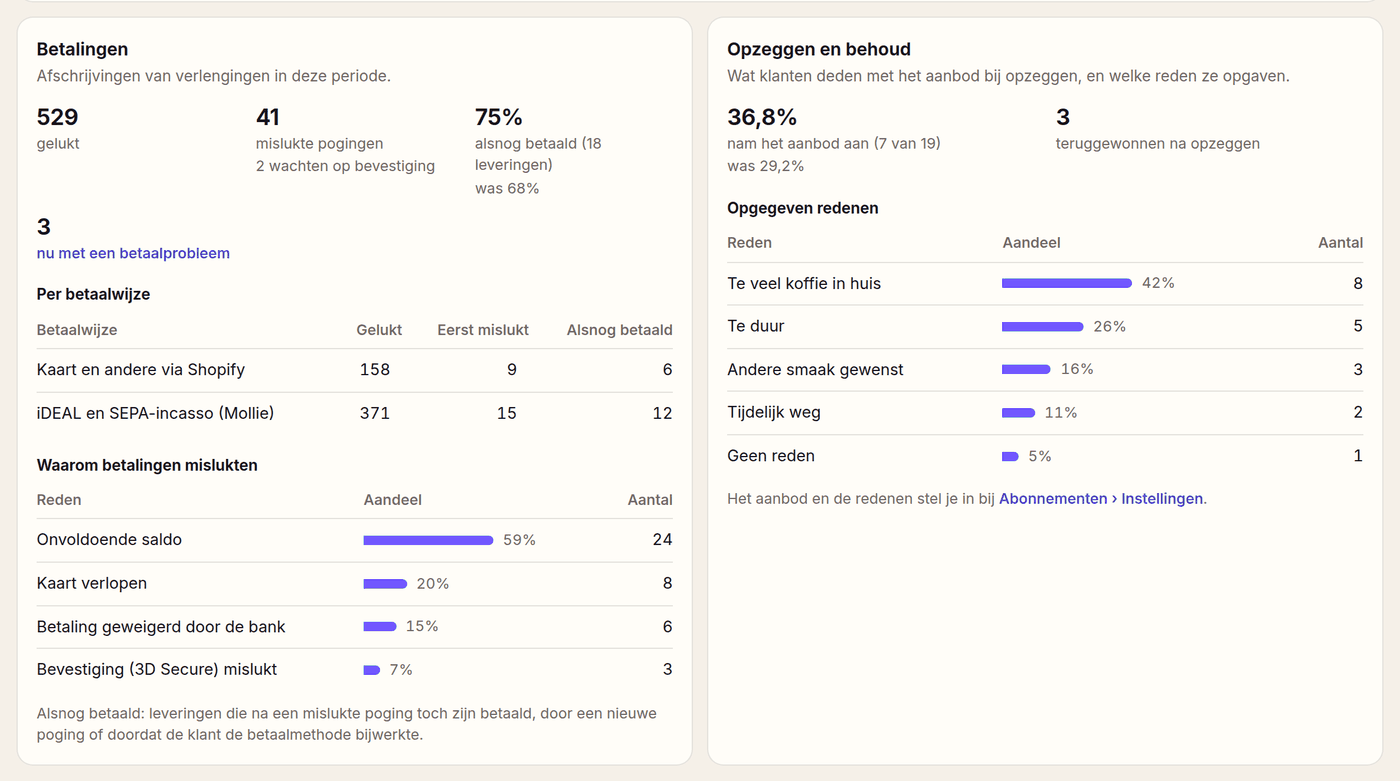
Split the numerator into two groups. Voluntary churn is a customer who cancels. Involuntary churn is a subscription that stops because the payment keeps failing: an expired card, too little balance, a withdrawn mandate. The causes differ and so does the fix. For the first group a pause, a different frequency or an offer at the moment of cancelling helps. For the second group a schedule of new attempts and a clear e-mail helps.
For the second group, track one figure separately: which share of the deliveries with a failed payment was paid after a new attempt. If that drops, your involuntary churn rises a few weeks later.
Churn analysis per cohort
A churn analysis goes one step further than the percentage: you find out who stops, when and why. Splitting voluntary from involuntary churn is the first step, the cancellation reasons are the second. The third is the cohort.
One percentage across your whole base mixes subscribers of three weeks with subscribers of three years. A cohort is the group that started in the same month. Track per cohort which share is still running after one, three and six months.
An example: 80 subscriptions start in April. After one month 74 are still running (92.5%), after three months 66 (82.5%) and after six months 60 (75%). Six stop in the first month, and eight in the five months after that. So churn here sits mostly right after the start. An average does not show that, and it points to the first deliveries: does the product match the expectation, does the frequency fit, does the customer know they can pause.
- Group by start monthPut every subscription in the month in which it started.
- Count what is still runningWork out per cohort which share is still running after 1, 3, 6 and 12 months.
- Compare cohortsPut the cohort from before and after a change side by side: a different welcome discount, a new frequency, a minimum term.
What is a normal churn rate?
There is no figure that holds for every shop. What is normal depends on what you sell and how you sell it:
- The product: something that runs out in the rhythm of the delivery, or something a customer builds up a stock of
- The frequency: the better it fits consumption, the less reason to stop
- The inflow: customers who came for a high welcome discount may leave once the discount ends
- The age of your base: a young base consists mostly of new subscribers, who tend to stop more often than subscribers who have stayed for a long time
- A minimum term or prepayment: churn then moves to the end of the term
So compare mainly with yourself: the same calculation, every month, per cohort. A useful test is the table above. Work out which share of a cohort is still running after a year, and whether that lifetime earns back the cost of acquiring the customer. Figures from other shops say little as long as you do not know how they count.
With 40 subscriptions, one cancellation more or less already makes a difference of 2.5 percentage points. With a small base, look at a quarter instead of a month, and do not draw a conclusion from one outlier.
Churn in Loyalo
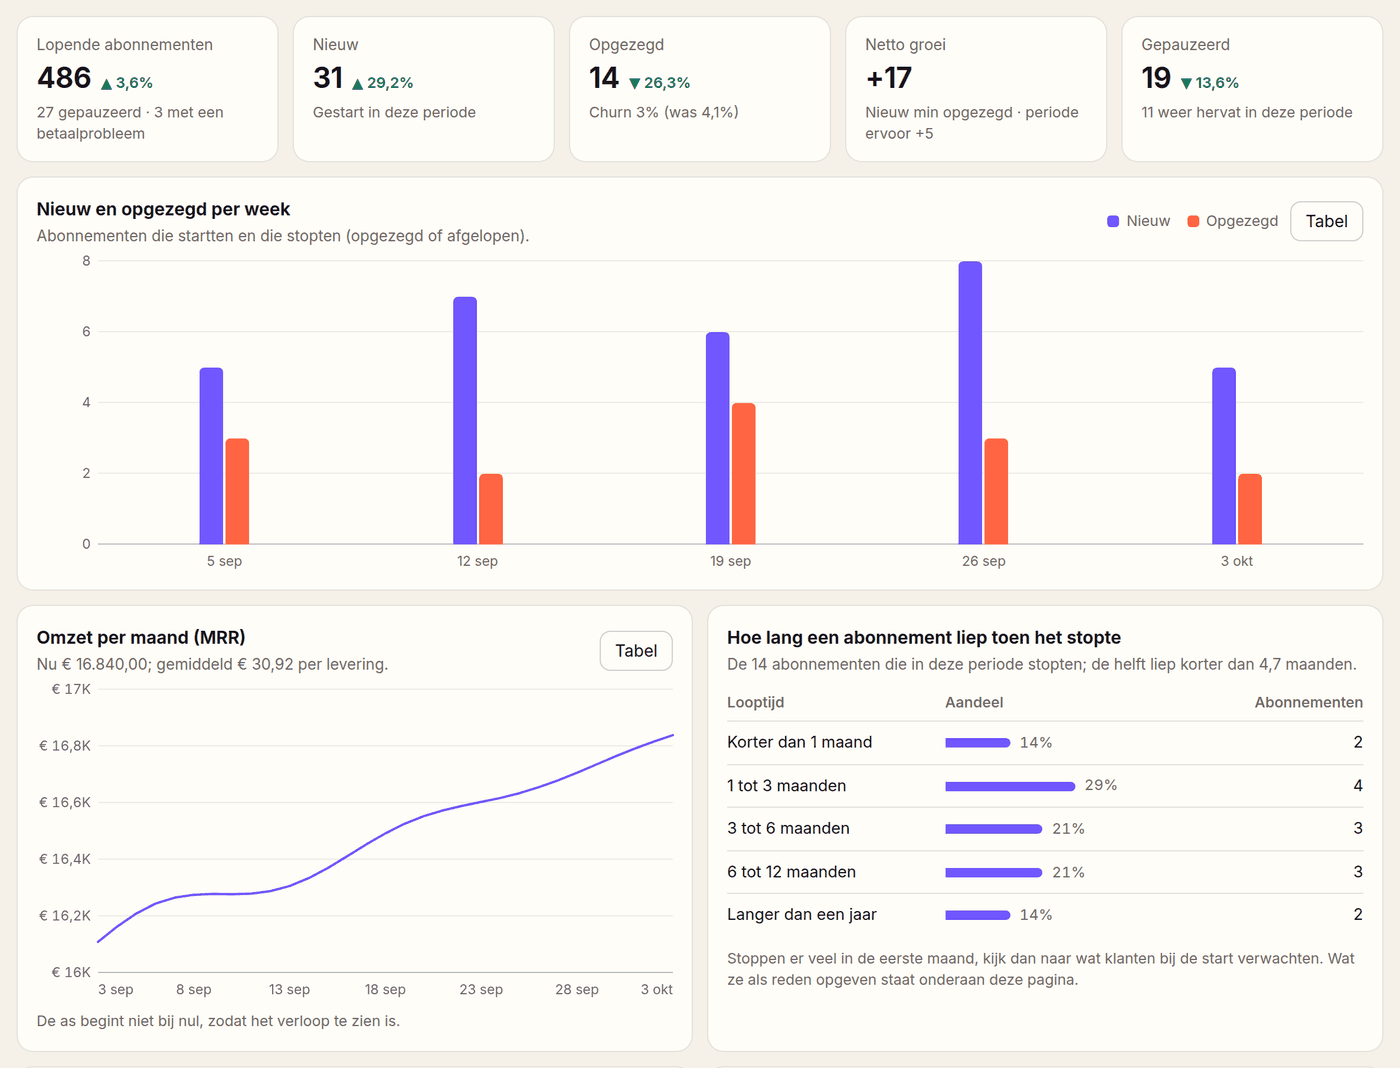
The Analytics page shows churn as cancelled ÷ running at the start of the selected period, next to the number of new and cancelled subscriptions per week. The cohorts section shows churn per month over the last 90 days, the expected lifetime and, per start month, the share that is still running. A paused subscription counts as running there, because the customer has not cancelled.
- Divide by the number of running subscriptions at the start of the period
- Do not count pauses and skipped deliveries as churn
- Convert a monthly figure to what remains after a year
- Track voluntary and involuntary churn separately
- Look per cohort, not only at the average
Frequently asked questions
What is subscription churn?
Subscription churn is the share of your subscriptions that stops in a period, through a cancellation or after failed payments. As a rate, it is expressed as a percentage of the subscriptions that were running at the start of the period.
What is a churn analysis?
A churn analysis finds out who stops, when and why, instead of only how many. You split churn into voluntary and involuntary, look at the cancellation reasons and track per cohort which share is still running after one, three and six months.
What is the difference between churn and retention?
They are two sides of the same figure. Retention is the share that stays, churn the share that stops. At 3.5% churn over a month, retention over that month is 96.5%, provided you use the same group and the same period.
Do I count a paused subscription as churn?
No. A pause is not a cancellation: the subscription still exists and can start again. Do track the number of pauses as a separate figure, because a pause that keeps being extended is often a cancellation in waiting.
How do I convert monthly churn to yearly churn?
Yearly churn = 1 − (1 − monthly churn) to the power of 12. At 3% per month that is 1 − 0.97 to the power of 12 = 31%. Multiplying by twelve gives a figure that is too high.
Over which period do I calculate churn?
Per month is the usual choice for subscriptions delivered monthly or more often. If you have few subscriptions, or quarterly deliveries, look per quarter so that one cancellation does not decide the figure.
Can churn be negative?
Customer churn cannot: fewer than zero subscriptions cannot stop. Net revenue churn can be negative, if the customers who stayed started spending more in that period than the leavers took with them in revenue.
Where do I see churn in Loyalo?
On the Analytics page, under Subscriptions (churn for the selected period) and under Cohorts and customer lifetime value (churn per month over the last 90 days and the course per start month).
See your own churn per cohort
In a demo we show where churn, cohorts and cancellation reasons are in Loyalo and how to read them.
Request a demo