Why these subscription KPIs belong together
The subscription metrics that matter are MRR (monthly recurring revenue), ARR (annual recurring revenue, the same revenue per year), churn, cohort retention, LTV, average lifetime and widget conversion. A subscription programme doesn't run on a single number. Revenue means little without knowing how many customers you're losing, and churn means little without knowing what a customer is worth on average. Together these KPIs form a complete picture: how much recurring revenue you have, how stable it is, and how well you acquire and keep subscribers.
The formulas in one overview. Below that is what each KPI means and how to read it.
| KPI | Formula | What it's used for |
|---|---|---|
| MRR | Sum of (subscription amount × monthly-equivalent frequency) across all active subscriptions | Tracking current recurring revenue month over month |
| ARR | MRR × 12 | Yearly growth and long-term planning |
| Churn rate | Number of subscriptions that stopped in the period ÷ number of running subscriptions at the start of the period × 100% | Measuring how many subscribers you're losing |
| Cohort retention | Subscriptions from a start month that are still running ÷ subscriptions that started in that month | Seeing when subscribers drop off and whether newer cohorts stay longer |
| Average lifetime | 1 ÷ monthly churn | Estimating how long a subscriber stays |
| LTV | Average revenue per subscription per period × average lifetime in periods | Estimating what a subscriber is worth over the full lifetime |
| Failed-payment recovery | Charges paid after a new attempt ÷ failed charges | Seeing whether your retries work |
| Widget conversion | Visitors who choose the subscription ÷ visitors who see the widget | Tracking the inflow of new subscribers |
MRR and ARR: meaning and formula
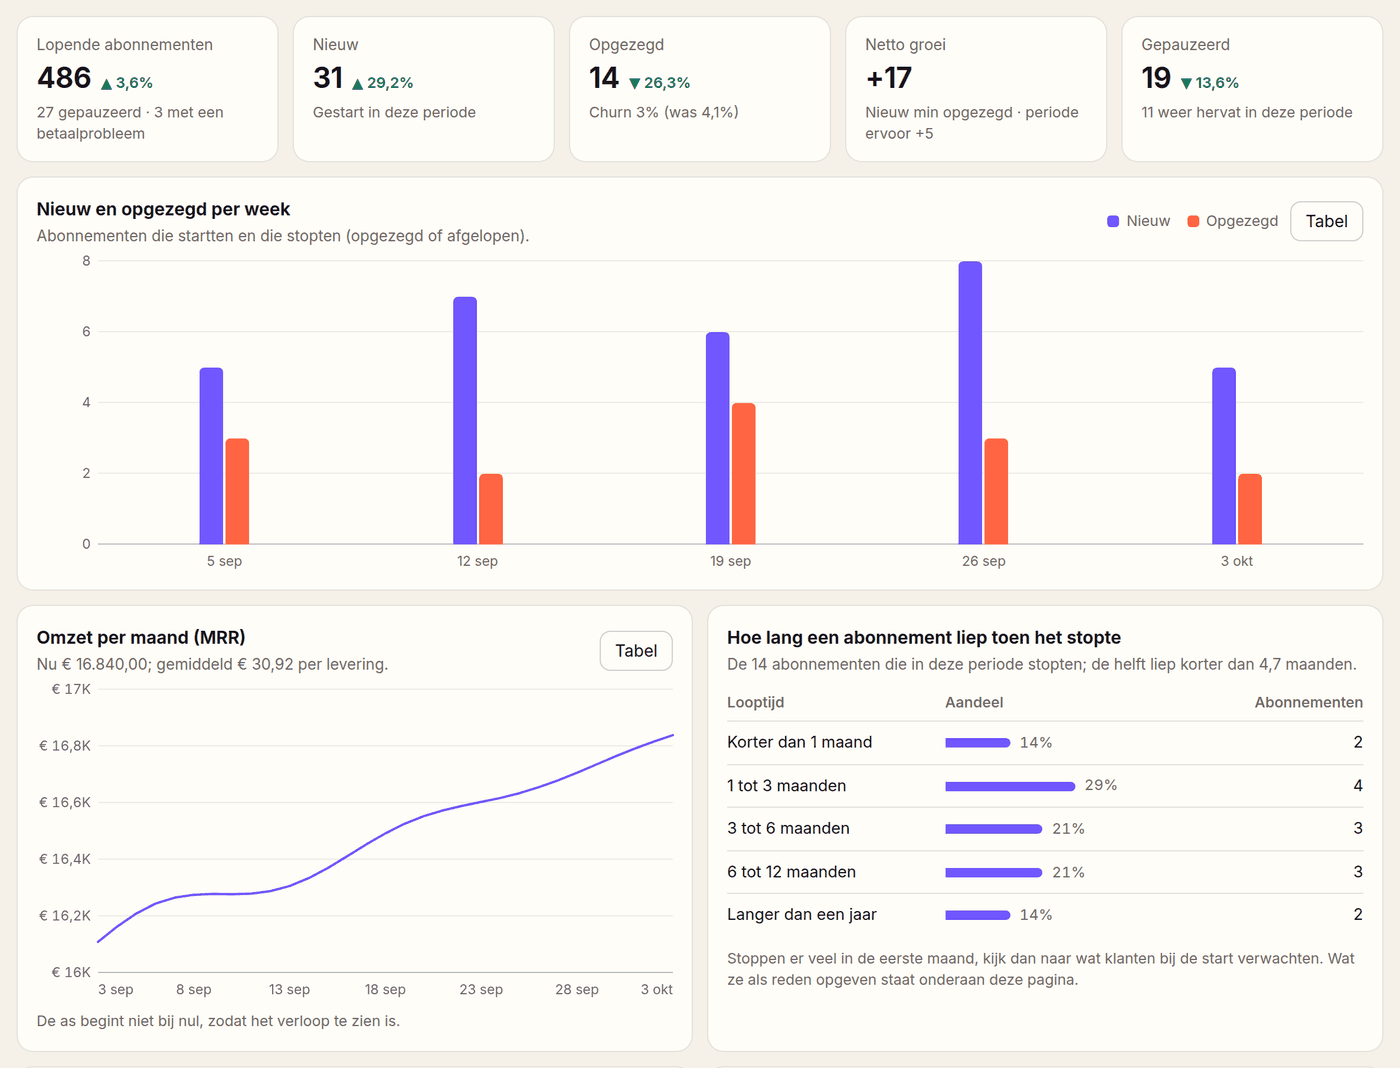
MRR stands for monthly recurring revenue: the recurring revenue you can expect in a given month from active subscriptions, normalised to a monthly amount. ARR stands for annual recurring revenue: the same recurring revenue on an annual basis. ARR is mainly used to discuss long-term growth.
The formula: MRR = the sum of the monthly amounts of all active subscriptions, and ARR = MRR × 12. For a subscription billed every four weeks, you convert the amount into a monthly equivalent so subscriptions with different frequencies stay comparable.
A worked example. A subscription of € 30 per month counts for € 30. A delivery of € 20 every two weeks counts for € 20 × 4.345 weeks per month ÷ 2, so a little over € 43. A yearly subscription of € 240 counts for € 20. With a hundred subscriptions of each, your MRR is € 3,000 + € 4,345 + € 2,000 = € 9,345 and your ARR € 9,345 × 12 = € 112,140. Leave paused subscriptions out: they bring in nothing this month.
Churn rate and cohort retention
Churn is the share of your customers or subscriptions that stops in a period. The formula: churn rate = the number of subscriptions that stopped in the period ÷ the number of running subscriptions at the start of the period × 100%. That includes cancellations and subscriptions that end involuntarily, for example through an unresolved failed charge. If 14 of 400 subscriptions stop in a month, churn is 3.5%.
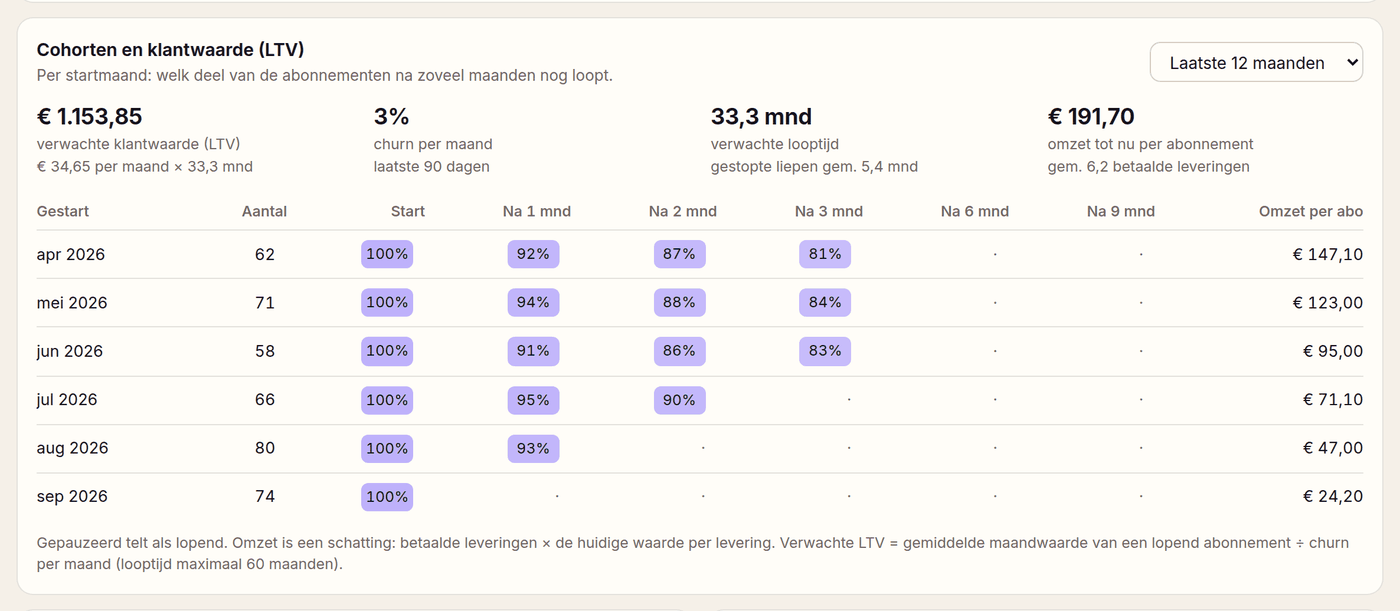
A single churn number across your whole customer base, however, hides big differences: new subscribers often cancel faster than customers who have stuck around for years. That's why cohort retention is more valuable: you group subscribers by their start month and track, per cohort, how many are still active after month 1, month 3, month 6 and beyond. The formula: cohort retention = the number of subscriptions from a start month that are still running ÷ the number that started in that month. This shows whether recent cohorts perform better or worse than older ones, and whether changes to onboarding or pricing are having an effect.
- Group by start monthSplit all subscribers into cohorts based on the month of their first payment.
- Track retention per periodCalculate, per cohort, what percentage is still active after 1, 3, 6 and 12 months.
- Compare cohortsPut cohorts side by side to see whether retention is improving or worsening over time, for example after a change to the widget or onboarding flow.
LTV and average lifetime
LTV stands for lifetime value, in full customer lifetime value (also CLV): an estimate of the revenue a subscriber brings in over the whole time they are a customer. A common baseline formula: LTV = the average revenue per subscription per month × the average lifetime in months. Average lifetime, in turn, follows from churn: 1 ÷ the monthly churn. The lower the churn, the longer subscribers stay active on average, and the higher the LTV.
LTV is mainly useful for checking whether the cost of acquiring a new subscriber is in proportion to what that subscriber ultimately generates, and for seeing how an improvement in retention affects the value of your customer base.
In numbers: at 3% churn per month the expected lifetime is one divided by 0.03, so a little over 33 months. When a subscription is worth € 24 per month on average, the LTV is about € 800. When churn drops to 2.5%, the lifetime becomes 40 months and the LTV € 960. With very low churn, use a maximum, 60 months for example; otherwise the formula predicts a lifetime you have never seen.
An average LTV across your whole customer base can mask large differences between segments. Where possible, break it down by product category or acquisition channel for a sharper picture.
Payments: the figure that is often missing
Most KPI lists leave out what happens to failed payments. Yet part of your subscriptions stops because of them, without the customer wanting that. So follow two figures: how many collections fail, and which share of those is paid after a new attempt. The formula for the second: charges paid after a new attempt ÷ failed charges. That figure tells you whether your retries work. When it drops, look at the days you retry on and at the email the customer gets.
Widget conversion: the start of the funnel
MRR, churn and LTV are about people who have already become subscribers. Widget conversion measures the start of the funnel: what percentage of visitors who see the subscription widget on the product page actually choose the subscription over a one-off purchase. The formula: widget conversion = visitors who choose the subscription ÷ visitors who see the widget. This KPI can be directly influenced through the widget itself (copy, price display, discount presentation), which makes it well suited to A/B testing. A higher widget conversion increases the inflow of new subscribers, which in turn grows MRR and, with churn held constant, also ARR.
- Calculate MRR on a monthly-equivalent basis, even for subscriptions with other frequencies
- Report churn per cohort rather than as a single overall number
- Use LTV to weigh acquisition costs against retention investments
- Track widget conversion separately from churn and LTV, since it drives the inflow of new subscribers
- Repeat cohort analyses regularly to see the effect of changes
Frequently asked questions
What does MRR mean?
MRR stands for monthly recurring revenue: the recurring revenue of your running subscriptions, converted to one month. A subscription of € 30 per month counts for € 30, a yearly subscription of € 240 for € 20.
What does ARR mean?
ARR stands for annual recurring revenue: your recurring revenue on a yearly basis. You calculate it as MRR × 12; at an MRR of € 9,345 the ARR is € 112,140.
What's the difference between MRR and ARR?
MRR is recurring revenue on a monthly basis, ARR is the same revenue expressed annually (MRR × 12). ARR is mainly used for long-term planning.
Why is churn per cohort better than a single churn number?
A single churn number across your whole customer base hides differences between new and long-term subscribers. Cohort analysis shows how retention develops per signup month and whether changes are having an effect.
How do I calculate average lifetime?
Average lifetime follows from churn: one divided by the monthly churn. At 3% that is a little over 33 months. The lower the churn, the longer subscribers stay active on average; that is the basis for the LTV calculation.
Why is widget conversion a separate KPI from churn and LTV?
Widget conversion measures the inflow of new subscribers, while churn and LTV are about customers who are already subscribers. Both sides of the funnel are needed for a complete picture of growth.
Do paused subscriptions count in MRR?
No. A paused subscription brings in no revenue in that period. In Loyalo the MRR only counts running subscriptions; in the cohorts a pause does count as 'still running', because the customer has not cancelled.
How often should I look at these figures?
Look at MRR, new subscriptions, cancellations and failed payments weekly: you can act on those quickly. Cohorts and LTV move more slowly; look at those monthly.
See these KPIs in your own dashboard
See in a demo how MRR, churn, cohorts and customer value are shown on Loyalo's Analytics page, and how you compare two versions of the widget with an A/B test.
Request a demo