Points and rewards
Customers with points, points earned and redeemed, where points come from, the most chosen rewards, revenue through rewards and the value of what is still outstanding.
Read moreWhat did your subscriptions bring in this month, and is that more than the month before? How many subscribers stop and what does a customer bring in on average? Loyalo works it out from the subscriptions and orders in your own store. You do not have to build an export or a spreadsheet for it.
Revenue per order says little about a subscription. You want to know what comes back every month, how long customers stay and where it goes wrong. Those figures are on one page.
The first tab counts the revenue of subscription orders: first orders and renewals apart. Every figure has the difference with the period before next to it. The chart shows revenue per day, week or month, with on the right what is scheduled to be charged next.
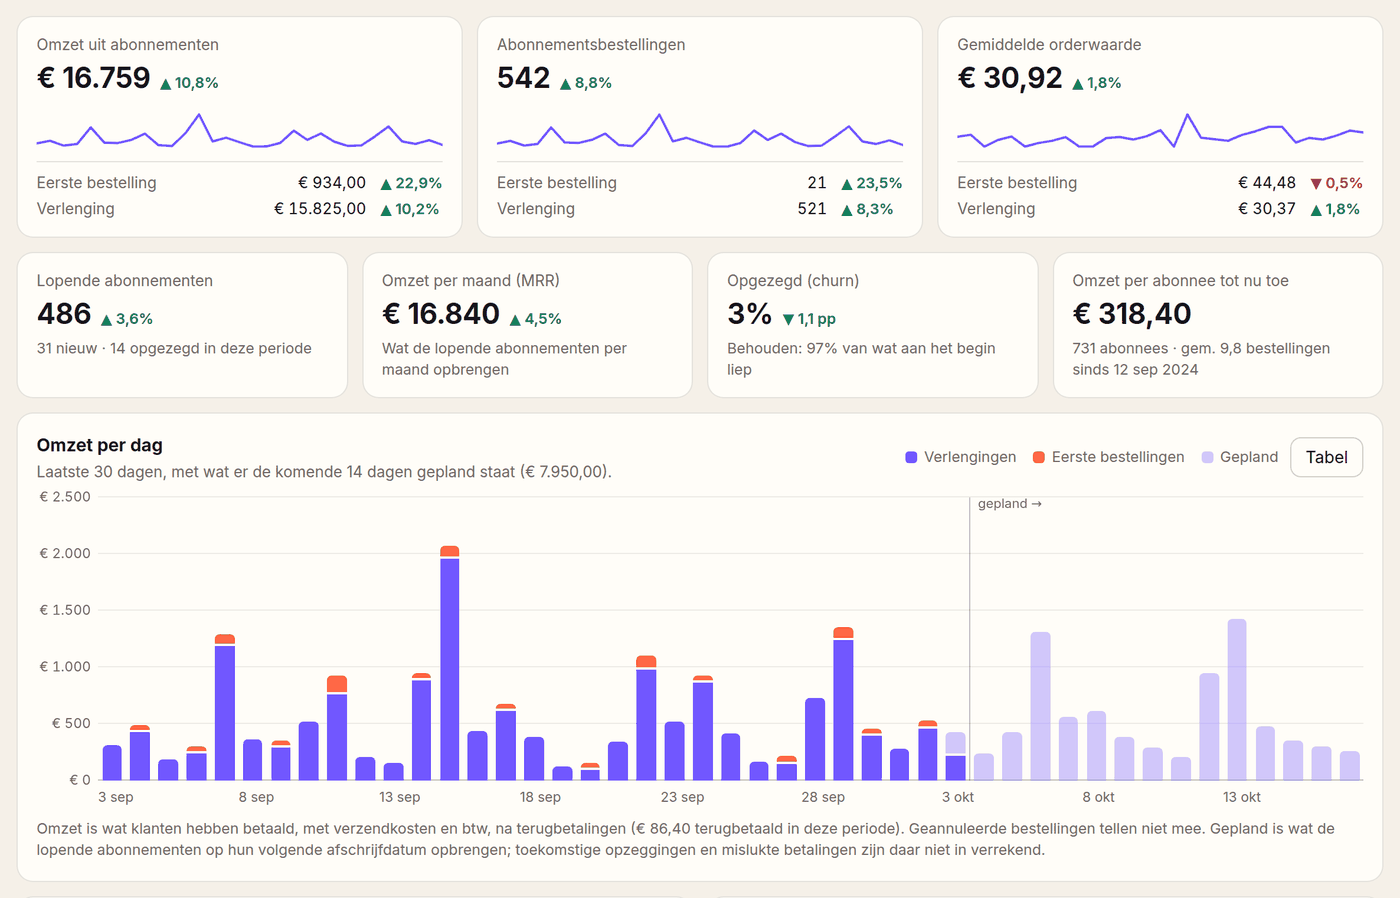
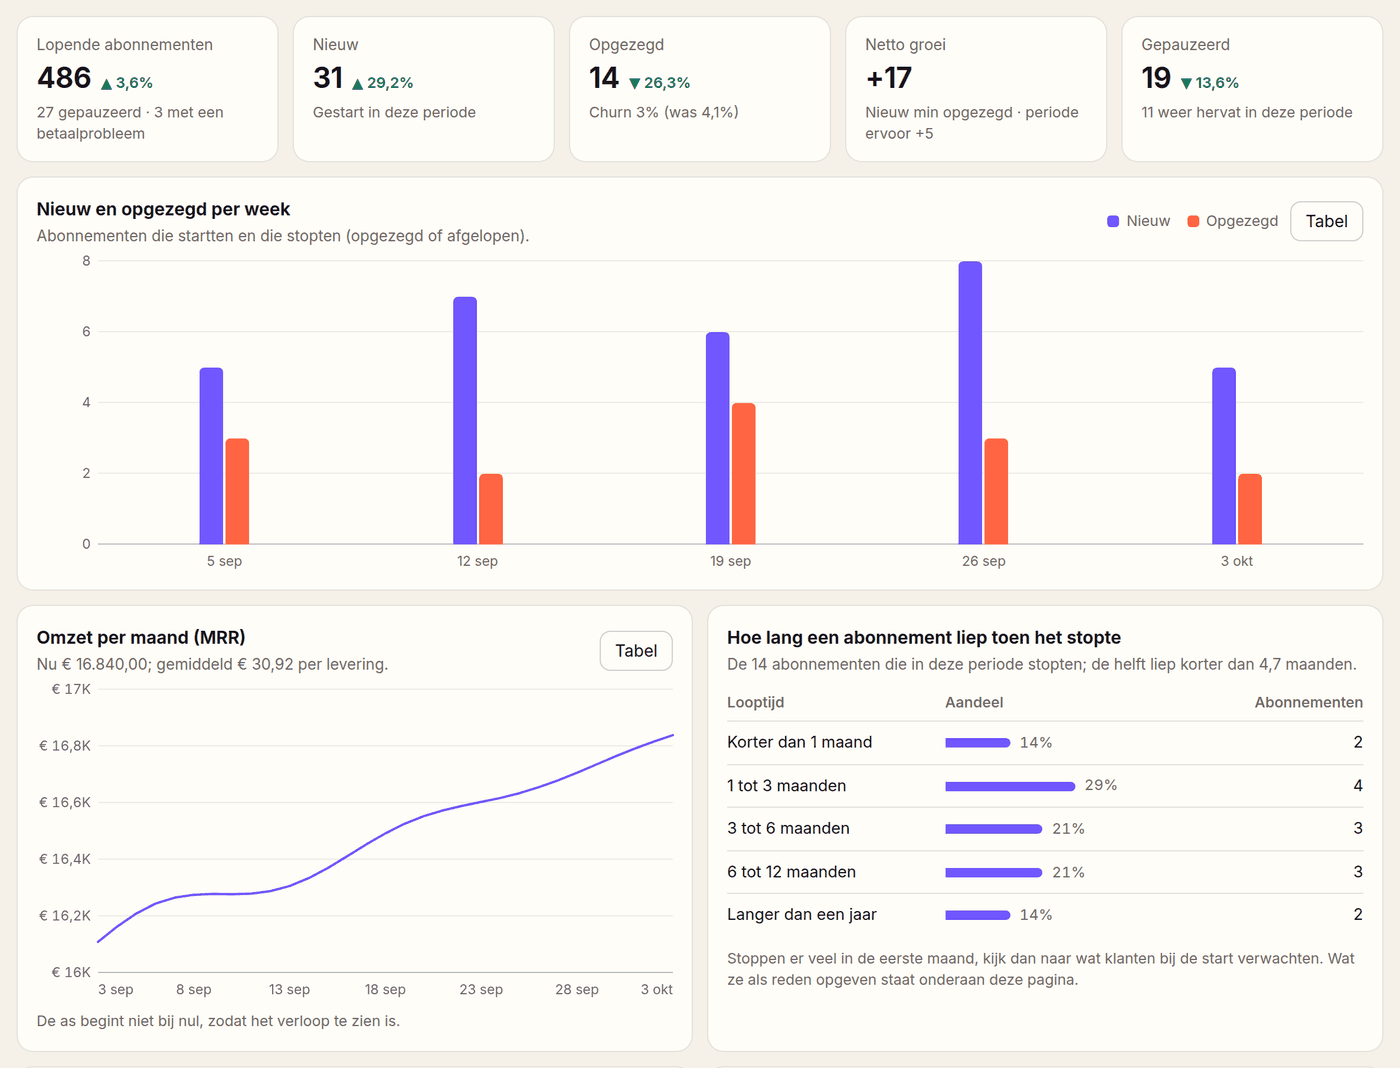
At the top you see how many subscriptions are running, how many were added and how many stopped. The chart puts new subscriptions next to cancellations per week, and the line below shows the MRR over time.
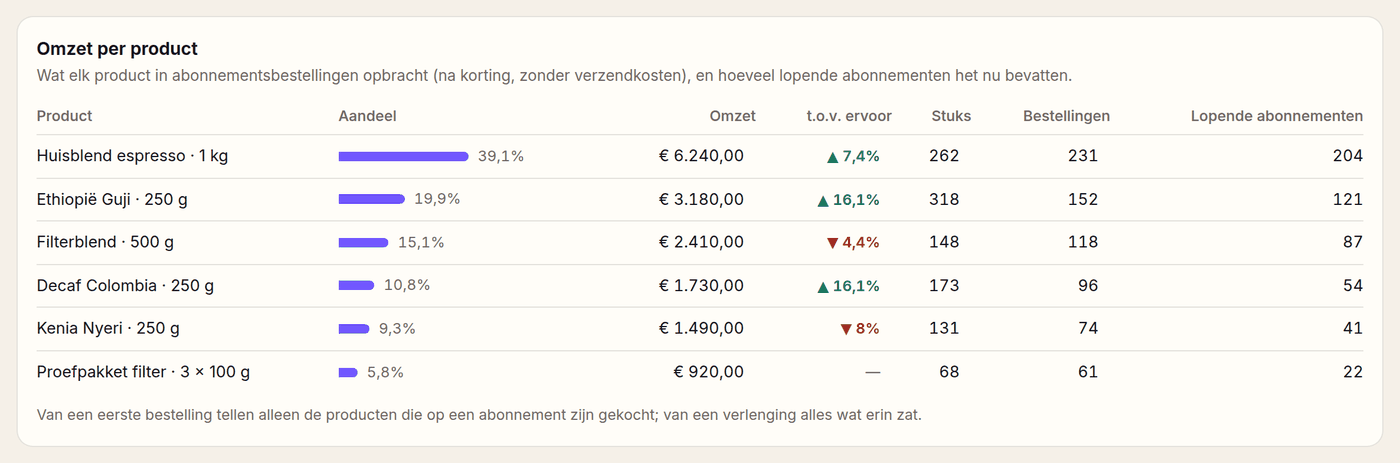
Per product you see what it brought in through subscription orders, which part of the total that is and whether it is growing. Next to it is the number of running subscriptions that contain the product now.
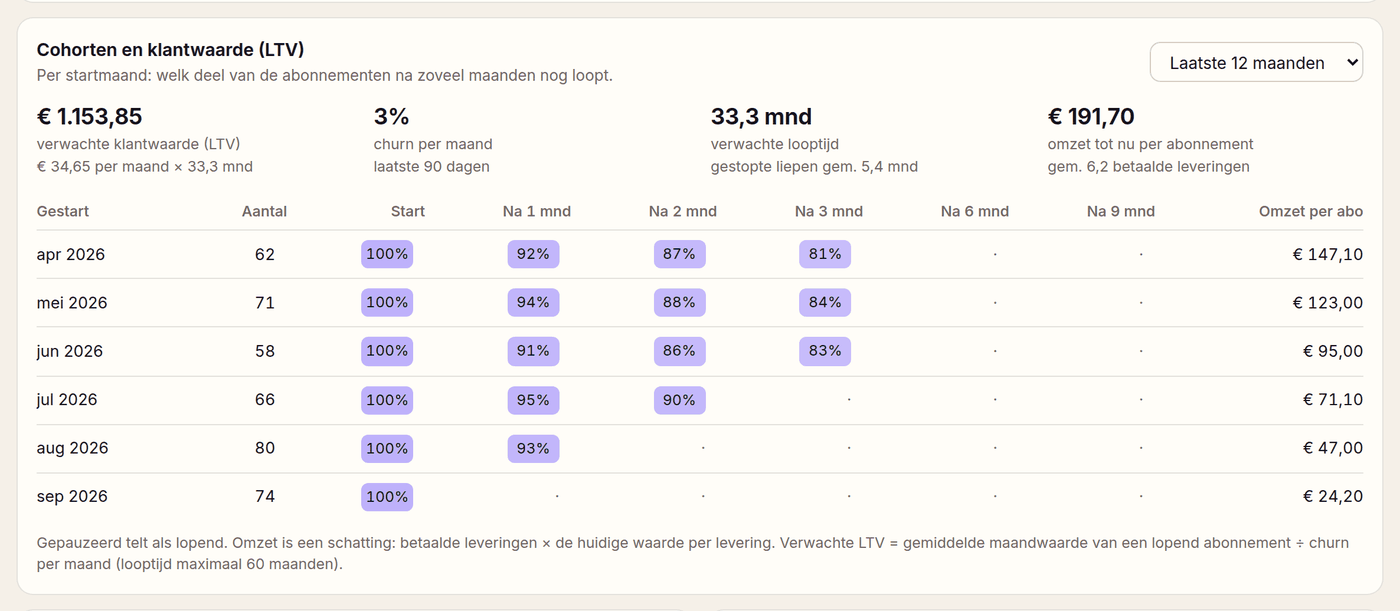
Per start month you see which part of the subscriptions is still running after 1, 2, 3, 6 and 9 months. Above it is the expected customer value: the average monthly value of a running subscription times the expected lifetime.
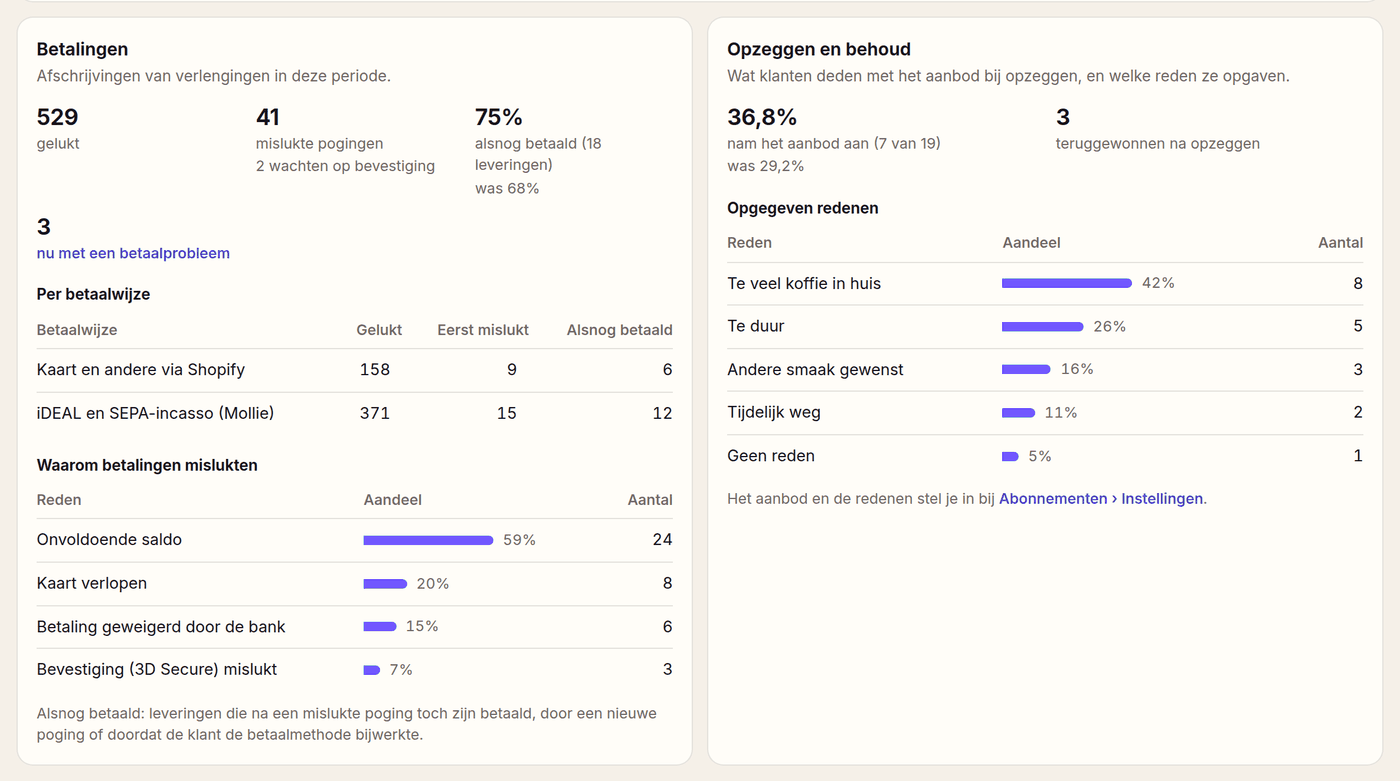
A subscriber who stops because a payment fails did not want to stop. Here you see how many attempts failed, how many deliveries were paid after all and how often an offer prevented a cancellation.
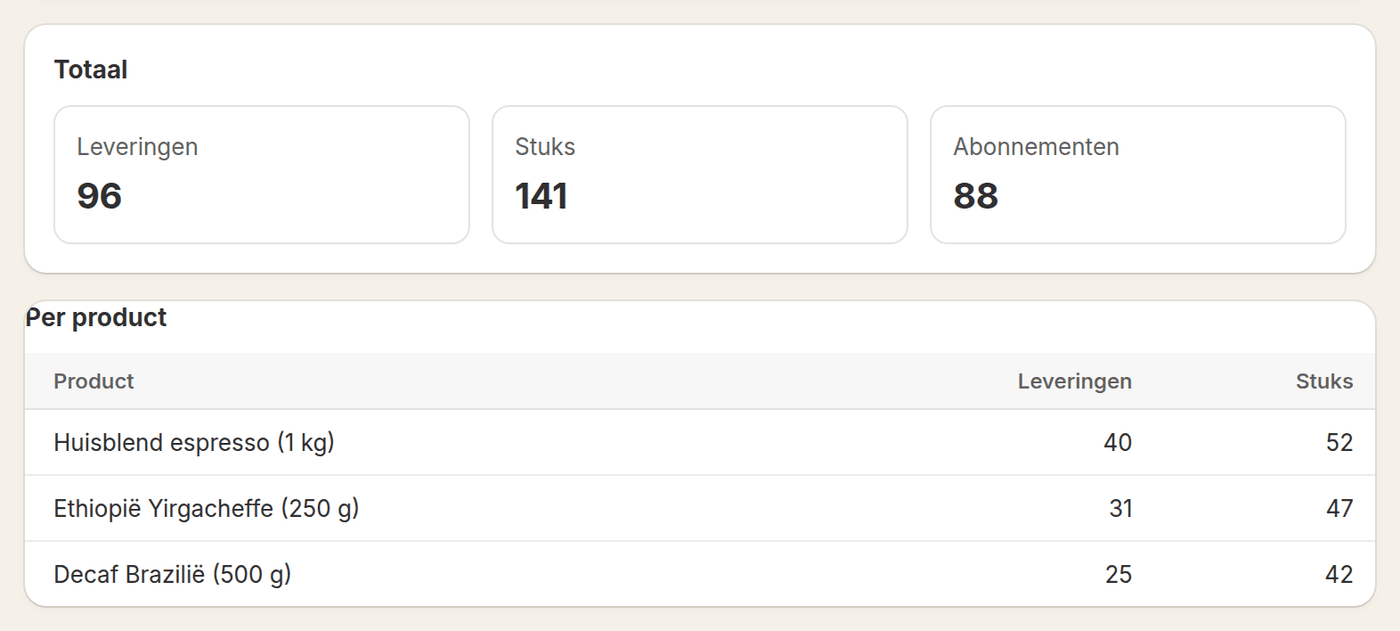
Figures about the past are useful, but your warehouse wants to know what is coming. The Deliveries page counts the deliveries and the number of items per product for the period you choose.
A figure is only useful when you know how it was worked out. These are the definitions the dashboard uses.
| Figure | Calculation |
|---|---|
| MRR (revenue per month) | The value of every running subscription, converted to a month and added up. A delivery of € 20 every two weeks counts for a little over € 43. Paused subscriptions and one-time extras do not count. |
| Revenue | What customers paid for subscription orders, with shipping and VAT, after refunds. A first order and every renewal count; cancelled and unpaid orders do not. |
| Scheduled | What the running subscriptions bring in on their next charge dates. A planned cancellation and a pause with an end date are counted; future cancellations and failed payments are not. |
| Churn | Of the subscriptions running at the start of the period, the part that stopped in the period. |
| Expected lifetime | One divided by the churn per month, with a maximum of 60 months. |
| Customer value (LTV) | The average monthly value of a running subscription times the expected lifetime. |
| Cohort | All subscriptions that started in the same month. The percentage is the part still running after that many months; paused counts as running. |
| Paid after all | Deliveries that were paid after a failed attempt, as a share of the deliveries where a payment failed. |
The customer value is an expectation based on your current churn, not a guarantee.
Customers with points, points earned and redeemed, where points come from, the most chosen rewards, revenue through rewards and the value of what is still outstanding.
Read moreHow many emails were sent per type, what was not delivered and which events went to Klaviyo.
A log of every change to a subscription or a setting: when, what and by whom.
Tasks that went wrong, such as an email or a collection, are in one place with the error and a button to retry.
A dashboard is only useful when you can act on it. Every figure belongs to a setting you change in the same app.
Read more about retentionMRR stands for monthly recurring revenue. Loyalo converts the value of every running subscription to a month and adds them up. A subscription of € 30 per month counts for € 30, a delivery of € 20 every two weeks for a little over € 43.
Loyalo divides one by the churn per month to get the expected lifetime, with a maximum of 60 months, and multiplies it by the average monthly value of a running subscription. At € 24 per month and 3% churn that is about 33 months and so around € 800.
Of the subscriptions running at the start of the period, the part that stopped in the period. You choose whether you look at 7, 30 or 90 days or a year, and you see the churn of the period before next to it.
A group of subscriptions that started in the same month. By looking per start month at which part is still running after a few months, you see whether your retention is getting better or worse, regardless of how many new customers you bring in.
Yes. On Analytics you export the subscription orders of the chosen period as CSV, one line per order. You also export subscriptions, customers and upcoming deliveries as CSV. For your own reporting you can also fetch the data through the API.
Analytics only counts subscription orders: the first order of a subscription and every renewal, with shipping and VAT and after refunds. One-off orders are not in it. Shopify counts all orders and has several revenue figures, such as gross, net and total sales.
Everyone with access to the app in your Shopify admin. Exporting is reserved for owners and admins.
Yes. Analytics, cohorts and the deliveries page are in every plan. You see the figures about points and rewards when you use Customer Loyalty.
Read on: Analytics and reportingBlog: the KPIs of a subscriptionBlog: how to calculate churn rateBlog: how to calculate customer lifetime valueAPI for your own reporting
In half an hour we show you how Loyalo works in your shop, or we send you an install link right away. The trial runs for 14 days and needs no credit card.
In a demo we go through the figures and show which setting belongs to which figure.